Detection-aided liver lesion segmentation using Deep Learning


introduction
In this work we propose a method to segment the liver and its lesions from Computed Tomography (CT) scans using Convolutional Neural Networks (CNNs), that have proven good results in a variety of computer vision tasks, including medical imaging. The network that segments the lesions consists of a cascaded architecture, which first focuses on the region of the liver in order to segment the lesions on it. Moreover, we train a detector to localize the lesions, and mask the results of the segmentation network with the positive detections. The segmentation architecture is based on DRIU(Maninis, 2016), a Fully Convolutional Network (FCN) with side outputs that work on feature maps of different resolutions, to finally benefit from the multi-scale information learned by different stages of the network. The main contribution of this work is the use of a detector to localize the lesions, which we show to be beneficial to remove false positives triggered by the segmentation network.
If you find this work useful, please consider citing:
@misc{1711.11069,
Author = {Miriam Bellver and Kevis-Kokitsi Maninis and Jordi Pont-Tuset and Xavier Giro-i-Nieto and Jordi Torres and Luc Van Gool},
Title = {Detection-aided liver lesion segmentation using deep learning},
Year = {2017},
Eprint = {arXiv:1711.11069},
}
Download our paper in pdf here.
Model
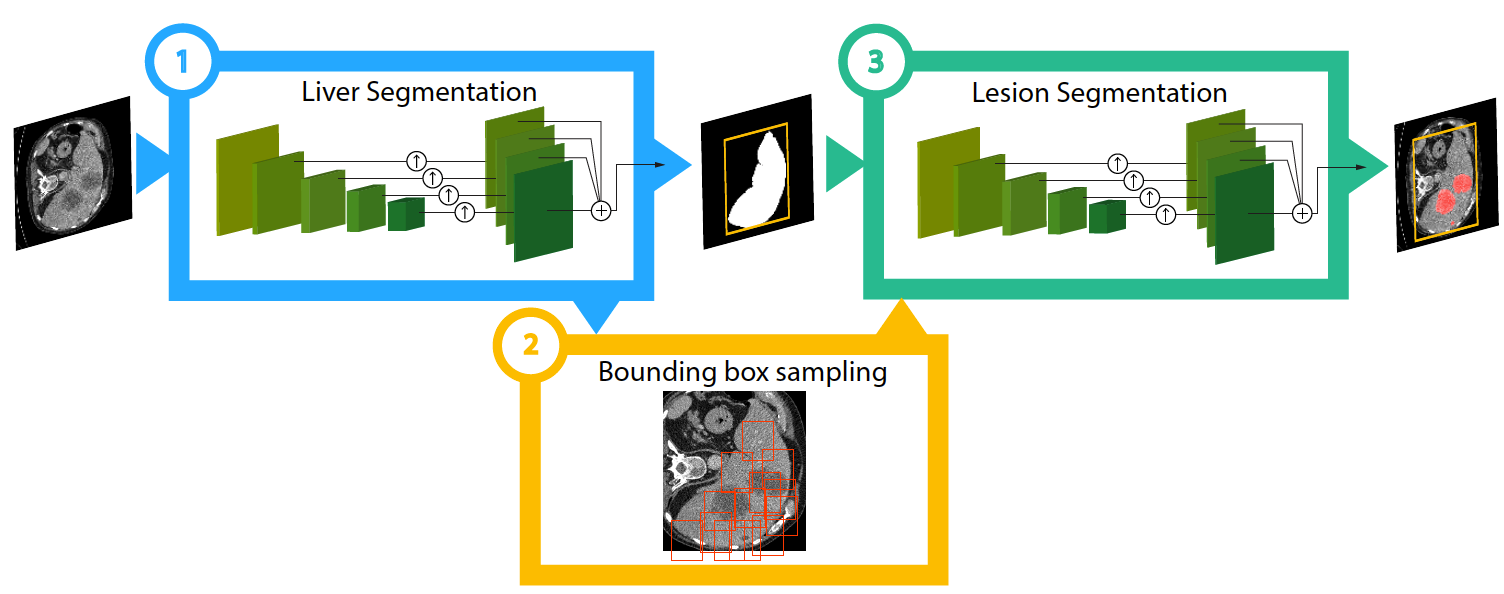
The architecture of the model can be seen in the following Figure. It is a cascaded architecture. First, the liver is segmented. Then, the liver region is cropped, and the lesion segmentation network segments the lesion. Finally, a detector samples a number of locations around the liver, and detects whether these liver patches are healthy or not. The final prediction of the lesion are the pixels where both the detection and the lesion segmentation network agree.
Results
We worked with the LiTS database, and did several submissions to the challenge. Please see the paper for results and discussion.
Examples
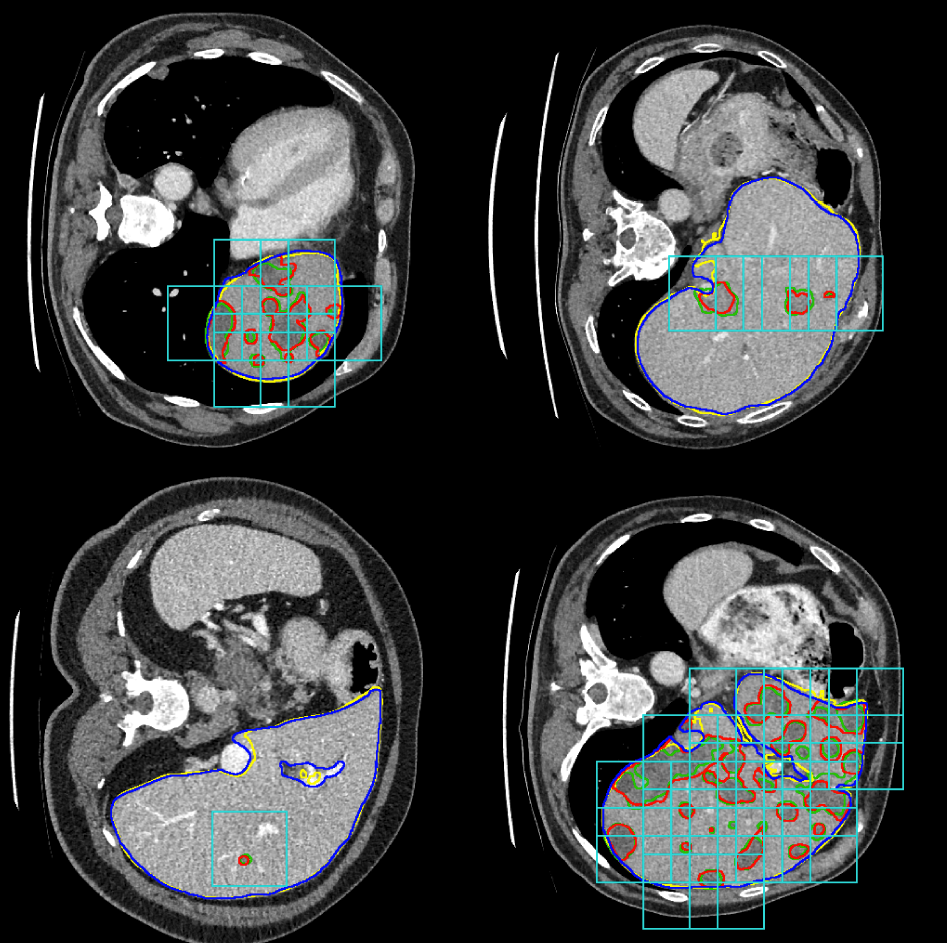
Some examples obtained with our method can be seen in the following figure. The yellow and green lines delineate the predicted liver and lesion, respectively. The blue and red lines, on the other hand, delineate the ground truth of the liver and lesion, respectively. Finally the light blue bounding boxes are the liver patches detected by the lesion detector.
code
This project was developed with TensorFlow.

acknowledgements
| This work has been supported by the grant SEV2015-0493 of the Severo Ochoa Program awarded by Spanish Government, project TIN2015-65316 by the Spanish Ministry of Science and Innovation contracts 2014-SGR-1051 by Generalitat de Catalunya |  |
| We gratefully acknowledge the support of NVIDIA Corporation through the BSC/UPC NVIDIA GPU Center of Excellence. |  |
| The Image ProcessingGroup at the UPC is a SGR14 Consolidated Research Group recognized and sponsored by the Catalan Government (Generalitat de Catalunya) through its AGAUR office. |  |
| This work has been developed in the framework of the project BigGraph TEC2013-43935-R, funded by the Spanish Ministerio de Economía y Competitividad and the European Regional Development Fund (ERDF). |  |